
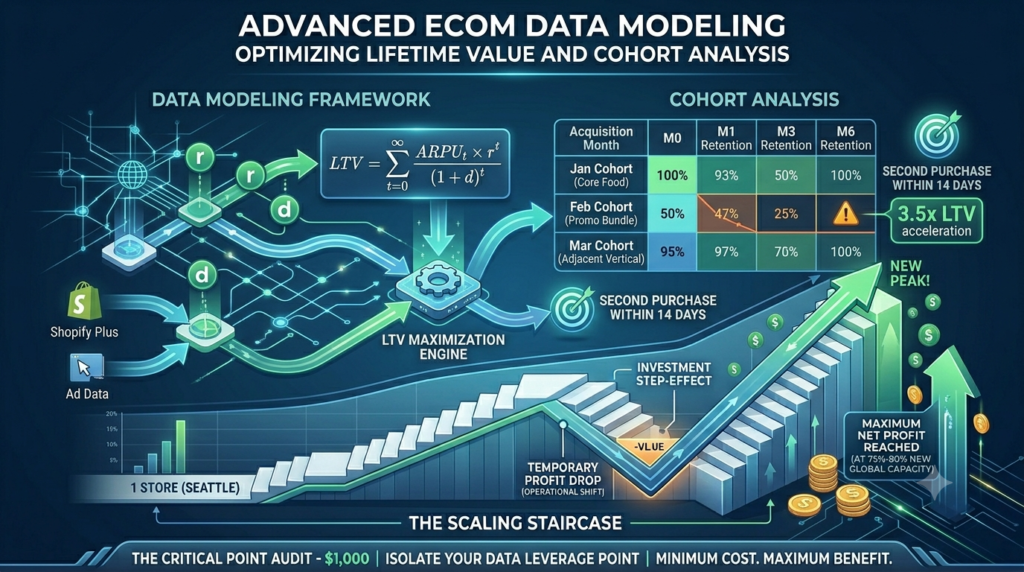
As an e-commerce platform scales past its initial growth phase, relying on surface-level metrics like blended ROAS or static conversion rates becomes a strategic liability. To achieve true systemic engineering, enterprise operators must shift toward predictive data modeling, focusing heavily on granular Cohort Analysis and Customer Lifetime Value ($LTV$) optimization to stabilize margins against rising acquisition costs.
1. The Mathematical Foundation of Scaled LTV
At high transaction volumes, retention ceases to be a simple marketing goal and transforms into a predictable financial engine. To model this asset accurately, the traditional, static calculation of $LTV$ must be upgraded to a dynamic predictive model that integrates the retention rate ($r$) and the discount rate ($d$).
The fundamental predictive model for calculating $LTV$ in a stabilized ecosystem is:
$$LTV = \sum_{t=0}^{\infty} \frac{ARPU_t \times r^t}{(1 + d)^t}$$
Where:
- $ARPU_t$: Average Revenue Per User at time tier $t$.
- $r$: Probability of customer retention (expressed as a decimal).
- $d$: The corporate discount rate or cost of capital adjusted for transaction latency.
When your transaction density crosses the critical volume threshold, the acquisition cost ($CAC$) for repeat cohorts becomes fully amortized. Consequently, every marginal transaction within the retention loop yields near-maximum net profit, acting as a structural shock absorber for the business.
2. Cohort Analysis: Isolating Structural Friction
Static data metrics frequently mask operational inefficiencies. A standard dashboard might show healthy overall revenue, while hiding the fact that recent customer cohorts are decaying at an accelerating rate.
Advanced data modeling requires organizing customers into Time-Based Cohorts (acquisition month) and Behavioral Cohorts (first-product interaction) to track performance metrics across a matrix:
| Acquisition Cohort | Month 0 (Acquisition) | Month 1 Retention | Month 3 Retention | Month 6 Retention |
| Jan Cohort (Core Food) | 100% | 42% | 38% | 35% |
| Feb Cohort (Promo Bundle) | 100% | 18% | 12% | 7% |
| Mar Cohort (Adjacent Vertical) | 100% | 39% | 34% | 31% |
Analyzing the Matrix:
- The Baseline (Jan): Represents stable, symmetric customer behavior with natural retention decay.
- The Friction Point (Feb): A steep drop-off in Month 1 indicates that while the front-end promotional funnel drove high initial volume, the cohort failed to establish ecosystem fit, signaling low asset density.
- The Leverage Indicator (Mar): Validates a successful expansion, maintaining high retention symmetry comparable to the core business model.
3. Finding the Data Leverage Point (The Predictive Moat)
Reaching an advanced data tier requires isolating your Strategic Leverage Point—the exact behavioral trigger that alters a cohort’s financial trajectory.
[ Raw Customer Acquisition ] ──► [ Threshold Trigger Event ] ──► [ 3.5x LTV Acceleration ]
Through predictive modeling, operators often discover specific behavioral thresholds that lock in long-term retention. For instance, data might show that a customer who purchases a second item within 14 days, or adopts a product from an adjacent vertical, exhibits a $3.5\times$ higher lifetime value than the baseline cohort.
Once this node is identified, backend workflows and automated retention loops can be structurally engineered to push every new user toward that exact action, converting raw data into capital efficiency.
4. Architectural Alignment for Predictive Modeling
Running complex predictive models requires a decoupled data architecture to prevent reporting latencies from slowing down your operational engine.
┌───────────────────────────┐      ┌───────────────────────────┐      ┌───────────────────────────┐
│   Front-End Touchpoints   │ ───► │    Central Data Warehouse │ ───► │  Predictive LTV Engines   │
│ (Shopify Plus, Meta Ads)  │      │   (ERP & Data Ingestion)  │      │   (Cohort Optimization)   │
└───────────────────────────┘      └───────────────────────────┘      └───────────────────────────┘
Your data ingestion layers must automatically clean, tag, and organize incoming multi-currency and cross-border transactions into unified data warehouses. If your database relies on manual exporting or siloed software integrations to reconcile cohort behavior, the resulting latency will distort your predictive models, leading to misallocated marketing capital.