
Once you have completed your initial operational efficiency audit and identified the points where improvements can be made, you face a critical corporate challenge: Data without visualization is incredibly difficult to execute.
The next phase of a conscious scaling roadmap is to take those individual metrics—warehouse capacity, conversion rates, and workflow speeds—and present them visually as an interconnected ecosystem.
When you scale, a business does not move in isolated silos. You cannot analyze a single department’s capacity in a vacuum. If a specific area is at 80% capacity and looks like it has a 20% margin to grow, you must calculate how that 20% increase impacts every other linked department simultaneously.
1. The Cascading Effect of a Front-End Spike
Let’s look at a concrete strategic shift. Suppose you optimize your front-end customer acquisition through highly sophisticated psychological conversion triggers, upgraded ad copywriting, and increased perceived value. Instead of pushing a single product, you shift your Meta Ads strategy toward high-ticket bundles.
This strategic front-end shift successfully generates a massive, rapid surge in sales volume. On paper, your marketing campaign is a triumph. However, true scaling requires mapping how this surge ripples through your entire underlying infrastructure.
2. Testing the Stress Limits of Your Infrastructure
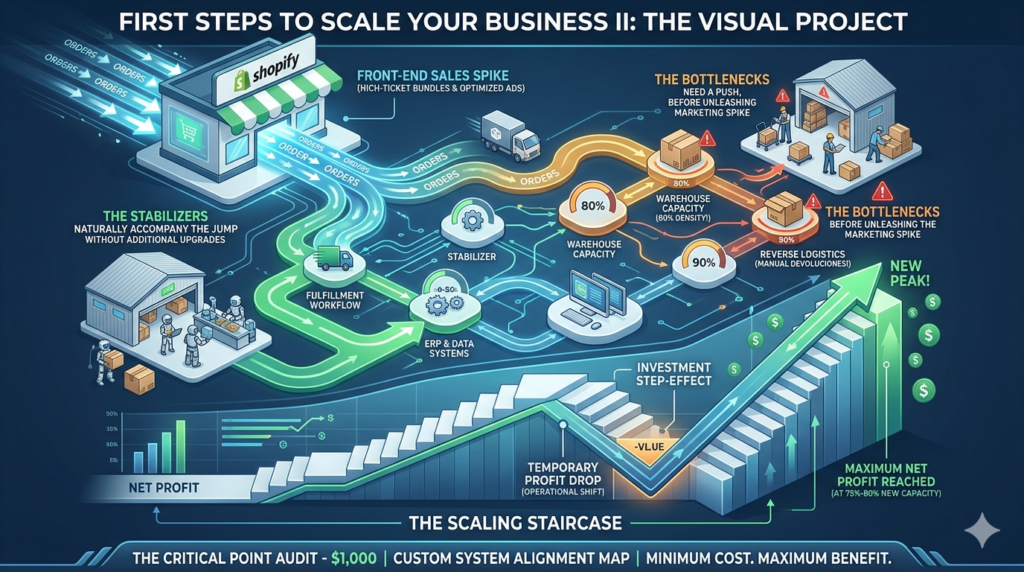
A visual project roadmap forces management to track the exact cascade of a front-end sales spike across your internal operational nodes to see who can smoothly absorb the weight and who will hit a wall:
- The Fulfillment Shock: Your marketing strategy successfully brings in more orders. Can your warehouse layout and current staff handle this sudden influx naturally? If your fulfillment setup is already running at high density, that extra volume will cause a severe bottleneck, resulting in delayed shipments and order backlogs.
- The Reverse Logistics Echo: More sales naturally result in a higher volume of product returns. Can your customer service workflows and reverse logistics protocols process this extra secondary wave smoothly? If your return management is manual, a sales spike will quickly bury your staff in uninspected inventory and delayed customer refunds.
- The Workflow Latency: When transaction volume spikes, every internal friction point is heavily amplified. Your automated data flows must synchronize across Shopify and your ERP flawlessly. If your data systems rely on manual intervention, your entire administrative structure will experience immediate, severe latency.
[ FRONT-END SALES SPIKE (Bundles/CRO) ]
                 │
                 ▼
[ WAREHOUSE CAPACITY ] ──► Can it absorb the picking volume?
                 │
                 ▼
[ RETURN MANAGEMENT ]  ──► Can it handle the reverse logistics echo?
3. Designing Your System Alignment Map
The core objective of creating a Visual Project is to explicitly categorize every operational node into one of two distinct groups:
- The Stabilizers (Those who accompany the scale): These are the departments, automated workflows, or infrastructure systems that possess enough operational runway to naturally absorb and support the extra transaction volume without any additional capital or structural changes.
- The Bottlenecks (Those who need a push): These are the systems or areas that are already operating near their stress limits. They require immediate optimization, process automation, or structural adjustments before you unleash the front-end marketing surge.
The Executive Benefit: Total Systemic Alignment
By mapping out your entire business architecture visually, you prevent the operational disasters that typically destroy high-growth e-commerce brands. Instead of driving blind traffic to a fragile system, you gain an excellent, top-down view of your business realities. This ensure that your front-end growth strategies match your back-end operational capacity perfectly, delivering a clean, predictable, and highly profitable transition to the next corporate tier.
The Financial Curve of Scaling: The Investment Step-Effect
In the architecture of scaling—whether you are optimizing a high-volume e-commerce brand, a complex system, or a high-ticket business—there is a structural reality that I always repeat because it is vital to fully comprehend before deploying capital: scaling requires an intentional, temporary squeeze on your net margins.
When your visual map shows that you need to upgrade two specific operational sections to handle a front-end spike, you are initiating an investment phase. Depending on the size of your business, this operational infrastructure shift will demand thousands or even millions of dollars, along with significant human capital and dedicated execution time.
Because of this upfront resource allocation, your net profit will immediately decrease in the short term. It is critical not to panic during this initial compression phase.
Net Profit
  ▲
  │          (New Peak!)
  │             ┌───► [New Structure at 75%-80% Capacity]
  │             │
  │   ┌─────────┘ ◄─── The "Investment Step" (Temporary Margin Drop)
  │   │
  ────┴──────────────────────────────────► Time
This temporary dip is simply the structural cost of building your next corporate tier. This new setup will only start generating a higher net profit than your previous baseline once the newly aligned infrastructure reaches 75% to 80% of its working capacity.
We can visually conceptualize this phenomenon as The Scaling Staircase. You take a temporary step down in net margin to reconstruct your back-end operational engine, but as soon as the system hits its new high-volume sweet spot, you achieve a clean, massive leap toward a brand-new peak of net profitability.