

Data in e-commerce is used to transform passive tracking into active execution. In 2026, leading brands use data for predictive demand forecasting, real-time price optimization, and hyper-personalized customer retention. While most stores use data to report what happened, high-performance brands use Micro-Data and curated prompts to identify high-density intent signals and exploit market opportunities before competitors notice.
How to use ecommerce data-driven intelligence to dominate competitors
In today’s aggressive digital landscape, competitive advantage is no longer just about who has the best product, but who possesses superior information before executing any move. One of the most powerful uses of ecomm-data is the ability to «listen» beyond your own borders. It is not just about looking at your internal metrics; it is about absorbing the entire market environment to find gaps your rivals have left wide open.
There is a massive opportunity in capturing high-value information directly from your competitors’ channels. By systematically analyzing the sentiment and friction points in your rivals’ customer interactions, you can discover critical flaws in their service or product delivery. If the majority of their customers are complaining about shipping delays or poor material quality in their social ads, ecommerce data-used strategically gives you the exact angle for your next campaign. You aren’t guessing what the market wants; you are offering a direct solution to a problem your competitor has already created. This is using their own market inertia to shift market share toward your store.
The 5 Pillar Applications of E-commerce Data
To understand what data is used for, we must distinguish between «reporting» and «engineering.» Here is how data drives the modern e-commerce architecture:
1. Predictive Demand Forecasting & Inventory Liquidity
Data is no longer just for checking stock levels; it’s about predicting the «Liquidity Peak» of every SKU.
- The Use Case: Brands use historical sales data combined with market micro-signals (like regional trends) to predict demand before it manifests.
- The Goal: Minimize «Dead Capital» and maximize inventory turnover.
2. Real-Time Price Optimization & Arbitrage
In a market where prices fluctuate hourly, static pricing is a slow death for margins.
- The Use Case: Using competitor data scraping and internal margin analysis.
- The Goal: Automatically adjust prices based on competitor stockouts or shifts in demand to capture the highest possible margin per transaction.
3. Hyper-Personalization & Churn Prevention
Data is the fuel for the «Segment of One.»
- The Use Case: Analyzing Zero-Party Data (quizzes, direct feedback) and behavioral patterns to predict the «Churn Window.»
- The Goal: Triggering an automated, personalized intervention to retain a customer before they click away.
4. Full-Funnel Attribution & Ad Spend Efficiency
With rising CAC (Customer Acquisition Cost) in 2026, you can’t afford to guess which ads work.
- The Use Case: Identifying the exact «Marginal Dollar» of profit to reallocate budget to the highest-performing channels in real-time.
[INSIDER NOTE]: The Average Trap
Most articles will tell you to watch your «Averages» (AOV, Bounce Rate). But averages hide the real profit. While your competition analyzes Big Data (what happened to everyone), you must focus on Micro-Data (the high-density signals happening right now).
Deep Dive:Big Data vs. Micro Data: Why Averages Hide Real Profit
E-commerce intelligence for high-level execution
High-level decision-making cannot depend on generic dashboards that only show the past. Dataecom is used to project future scenarios and automate responses before problems arise. If you understand how your recurring customers behave and what signals precede a purchase, you can automate loyalty actions before the user decides to switch to a competitor.
The information captured from competitors, cross-referenced with your own margins and ad efficiency, creates an ecosystem of «Knowledge before Execution.» You no longer launch a campaign to «see what happens»; you execute because the data has shown a market anomaly that you can exploit. At this level of the game, every dollar spent has a mathematical purpose and a clear direction based on market reality, rather than the hopes of a marketing team.
[CASE STUDY]: High-Density Signal Execution (Padel E-commerce)
Let’s look at a real-world scenario of how data is used to engineer a Profit Peak.
The Situation:
Our research identified an imminent flood of young players entering the professional Padel circuit. We focused on a specific model: The Pro-Junior Racket (National Production).
The «Gold Nugget» Data:
- Net Margin: +40% (vs. 18% for global brands).
- Logistics Advantage: Local production means reduced shipping costs and optimized packaging.
- Market Signal: 300% increase in search volume for «pro-junior rackets» in the last 90 days.
Strategic Stock Allocation (Analysis vs. Options)
Instead of an «Average» stock buy, we used data to concentrate capital where the math was strongest.
| Racket Model | % Stock Allocation | Net Margin | Strategy |
| Pro-Junior (National) | 50% | 42% | Aggressive Scaling (Hero SKU) |
| Top Global Model | 15% | 18% | Brand Retention |
| Entry-Level Model | 10% | 12% | Quick Liquidation |
| Other 7 Models | 25% | 20% avg. | Catalog Long-Tail |
The Result: By ignoring «averages» and using micro-data to spot the regional shift (tennis-to-padel conversion in high-competition clubs), the brand achieved a 35% global net profit spike while the rest of the sector struggled at 12%.
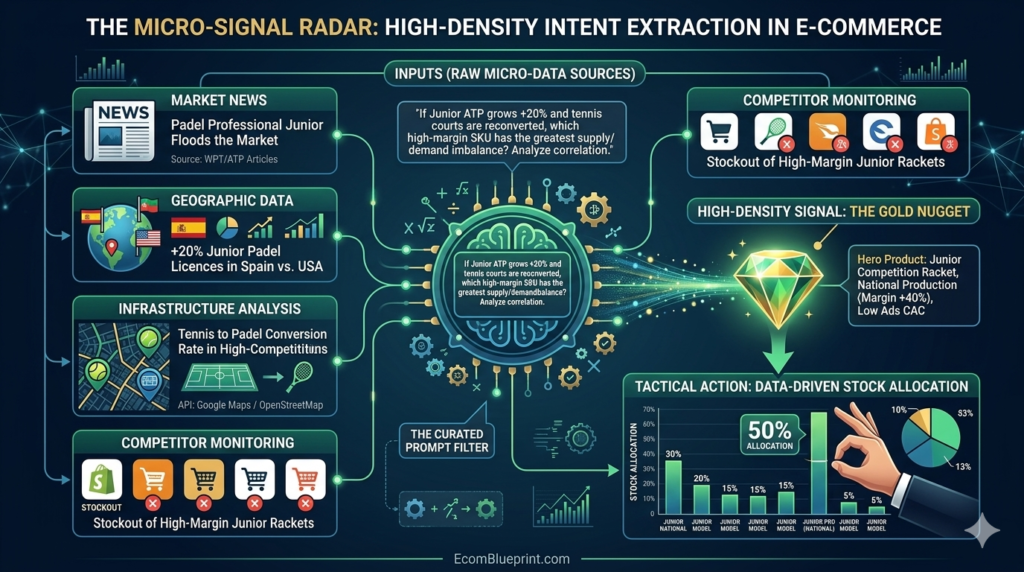
The Final Layer: The Curated Prompt Radar
This process is not done blindly. In 2026, the competitive edge belongs to those who use Curated Prompt Architectures to mine these gold nuggets.
By feeding an AI model with seemingly disconnected variables—such as ATP/WPT news, Geographic Infrastructure data (tennis courts being transformed into padel courts in the USA and Europe), and Competitor Stock Latency—you can extract high-density intent signals that a dashboard will never show you.
Scaling is not a ladder; it’s a series of jumps. And data is the only map that tells you where the next peak is located.